CFD: methods, equations and what was measured¶
Computational fluid dynamics in Lagrange, as of 2026-11-02, on branch feat/cfd-openfoam. It has two
tools, and this document says what each one does, which equations it solves, how far its numbers can
be trusted, and what comes next.
Which to use (decided 2026-11-02): lagrange foam for force numbers, lagrange tunnel for seeing
and animating the flow. Sections 6 and 7 are why: OpenFOAM reaches the Ahmed body’s measured drag at
25° in minutes, and nothing tried on the tunnel brings its drag below about three times the measurement. Short notes on the tunnel also live in
aerodynamics.md §10.
1. Two tools¶
|
|
|
|---|---|---|
Method |
Lattice Boltzmann, D3Q19, Smagorinsky LES |
Finite volume, SIMPLE, k-omega SST RANS (OpenFOAM) |
Code |
Our own, CPU reference and GPU (Slang) |
OpenFOAM v2512, a separate GPL-3 program |
Time |
Transient: the wake moves |
Steady: a mean flow |
Mesh |
Uniform cubes, staircase surface |
Refined near the body, fitted to it, with layers |
Needs |
Nothing more |
An installed OpenFOAM, or podman or docker and a 1.6 GB image |
Use it for |
Seeing where the air goes, animations, a wind field |
Force numbers, per link, and pressure on the body, within section 6’s limits |
flowchart LR
    R[Robot file] --> L[Collision shapes]
    L --> T[lagrange tunnel]
    L -->|--export-surface: STL, bounds| F[lagrange foam writes a case]
    F --> S[surfaceFeatureExtract, blockMesh, snappyHexMesh]
    S --> P[potentialFoam, simpleFoam]
    P --> C[report.json: Cd, Cl]
    P --> V[lagrange_foam_to_vdb]
    T --> W[flow.nvdb, flow.vti, flow_view.usda, frames]
    V --> N[Wind field for a run]
    W --> N
The boundary with OpenFOAM is files only. Lagrange writes its input and reads its output and never
links or ships it, which keeps Apache-2.0 intact and follows invariant 12 of CLAUDE.md. The method
is free to learn from; its source is not free to copy into this repository. The dictionaries in
tools/cli/lagrange_foam are written from the documented keywords, and OpenFOAM’s own tutorial
files were read for syntax only.
2. The incompressible flow both approximate¶
Mass and momentum for an incompressible Newtonian fluid, with kinematic pressure \(p\) (Pa per kg/m³), velocity \(\mathbf{u}\) and viscosity \(\nu\):
\(\nu_t\) is what the turbulence model adds for motion the grid does not resolve. What reports use, for wind speed \(U\) and frontal area \(A\):
3. lagrange tunnel: lattice Boltzmann¶
Populations \(f_i\) move along 19 lattice velocities \(\mathbf{c}_i\) and relax towards equilibrium (BGK; Krüger et al., The Lattice Boltzmann Method, 2017):
in lattice units, with \(w_0=1/3\), \(w_{1..6}=1/18\), \(w_{7..18}=1/36\). Eddy viscosity comes from the non-equilibrium stress \(Q_{\alpha\beta}=\sum_i c_{i\alpha}c_{i\beta}(f_i-f_i^{eq})\) (Hou et al. 1996):
At walls, half-way bounce-back, with a moving road by Ladd (1994). Force is momentum exchange on each link, less the resting state’s (gauge):
The inlet imposes \(f_i^{eq}(\rho{=}1,U)\) and the outlet copies its last column. Sides wrap around.
Frames¶
--frames N writes speed in a slice along the body over \(C_p\) in a slice from above, smoothly
interpolated over fluid cells only, with scales in frames/legend.json. --frame-spin draws the air’s
spin instead. Forces do not depend on it (FramesDoNotChangeTheForce).
4. lagrange foam: finite volume with OpenFOAM¶
The steps of the generated Allrun:
flowchart TD
    A[surfaceFeatureExtract: edges of the STL] --> B[blockMesh: background box]
    B --> C[snappyHexMesh: refine, cut out the body, snap to it, add layers]
    C --> D[checkMesh]
    D --> E[potentialFoam: a first flow without viscosity]
    E --> G[simpleFoam: iterate to a steady mean flow]
    G --> H[reconstructPar, writeCellCentres]
SIMPLE finds the pressure that makes the velocity divergence free. In each iteration, with \(A\) the diagonal and \(\mathbf{H}\) the off-diagonal part of the discretised momentum equation (Jasak 1996):
k-omega SST (Menter 1994) transports turbulent kinetic energy \(k\) and specific dissipation \(\omega\), and limits the eddy viscosity with the blending function \(F_2\) and strain rate \(S\):
Wall functions replace resolving the boundary layer: for a first cell at \(y^+=yu_\tau/\nu\) above
about 30, the log law gives the wall friction (nutkWallFunction, omegaWallFunction,
kqRWallFunction):
Choice in the case |
Value |
|---|---|
Domain |
3 body lengths ahead, 8 behind, 2 each side, 3 above |
Background cell |
Longest size / 8 |
Surface cell |
Background / \(2^{\text{refine}}\); wake box two levels coarser |
Layers |
|
Inlet |
Fixed velocity; intensity 1 %, \(k=\tfrac32(IU)^2\); length scale 5 % of the body |
Outlet |
Fixed pressure, 0 |
Sides and top |
Slip |
Road |
With |
Schemes |
|
Report |
Mean of the last fifth of the iterations, and half its range as “moves” |
Run it and look at it:
lagrange foam ROBOT --speed 40 --ground --clearance 0.05 --out case   # the container if none installed
paraview case/case.foam
ros2 run lagrange_fields lagrange_foam_to_vdb case/2000/C case/2000/U flow.nvdb --voxel 0.05
What a run leaves in the case folder:
File |
What |
|---|---|
|
Cd and Cl with how much they still move; each link’s force in N, total, pressure and viscous ( |
|
\(C_p\) on the body from the side and from above, and along its middle, the strongest suction marked |
|
Open in ParaView |
|
For |
lagrange foam ROBOT --read-only --speed U --out CASE redraws pressure.png and rereads the forces of a
finished case. Wall pressure is taken from the nearest cell centre, which is what OpenFOAM’s
zeroGradient wall condition gives.
Limits today: a capsule is exported as a cylinder; --yaw turns the shapes but the road’s direction stays
along the wind; wheels do not turn.
5. The test: the Ahmed body¶
The Ahmed body (Ahmed, Ramm & Faltin, SAE 840300, 1984) is the standard car-like reference: length
1.044 m, width 0.389 m, height 0.288 m, a 0.1 m radius on all four front edges, 50 mm over the floor. Our model, from
assets/robots/ahmed_body/make_ahmed_body.py, is one convex shape with no stilts, and 40 m/s gives
\(Re=2.8\times10^6\) on the length (ERCOFTAC case AC1-05 at this speed).
Sources quote its measured drag differently: 0.2875 at 25° (SimScale’s validation page, citing Ahmed
1984, at 60 m/s) and 0.298 at 25° with a moving ground (Strachan et al. 2007, quoted in arXiv
2001.11074). No figure for 35° has been checked yet: TODO(verify) against the source (Lienhart & Becker, SAE
2003-01-0656). A study quoted on the CFD-Wiki says drag is smaller at 35° than at 25°. Drag is
known to fall past about 30°, the “drag crisis”.
6. Results¶
All one run each, on this machine (20 threads, RTX 4060 laptop GPU), 2026-11-02, on the corrected shape below. ± is half the range over the last fifth of the iterations.
OpenFOAM, 1500 iterations on 12 processes:
Slant |
Cells |
Cd |
Cl |
Body \(y^+\), mean |
Wall time |
|---|---|---|---|---|---|
25° |
218,981 |
0.288 ± 0.000 |
0.273 ± 0.000 |
150 |
4.8 min |
25° |
749,791 |
0.266 ± 0.000 |
0.292 ± 0.000 |
109 |
19 min |
35° |
220,736 |
0.344 ± 0.038 |
0.257 ± 0.120 |
149 |
5.3 min |
35° |
750,247 |
0.358 ± 0.018 |
0.411 ± 0.075 |
109 |
21 min |
Layers covered 77 to 88 % of the body. On 750k cells at 25°, drag is half friction and half pressure in
OpenFOAM’s split (Cd(f) 0.133, Cd(r) 0.133).
Our tunnel, GPU; the road gap is 2.2 cells at 2M and 3.5 at 8M:
Slant |
Cells |
Cd |
Cl |
|---|---|---|---|
25° |
2M |
1.345 ± 0.031 |
0.27 |
25° |
8M |
1.256 ± 0.013 |
0.37 |
35° |
2M |
1.367 ± 0.026 |
0.27 |
35° |
8M |
1.277 ± 0.028 |
0.34 |
What this says:
OpenFOAM at 25° is at the measurement’s size. 0.288 and 0.266 against 0.2875 to 0.298. But it moved 8 % between the two meshes and away from the measurement, so this is agreement in size, not a mesh-independent result. Finer meshes are not done on this shape.
OpenFOAM at 35° is not trustworthy yet. Drag reads above 25°, and the measured fall past about 30° does not appear. It also still moves between iterations. Steady RANS is reported to struggle near this angle, and the 35° reference is unverified.
The tunnel is over four times too high, and the cause is not resolution alone. OpenFOAM gets 0.29 on 219k cells; the tunnel gets 1.26 on 8M. Friction explains little of it: 0.014 from the plate times 12.6 wetted areas per frontal area is about 0.18. So most of the excess is pressure, which is where section 8’s stripes and offset sit. Whether they cause it has not been measured.
The cube’s good number proves little. It reads 1.03 against 1.05, on a body whose drag is nearly all pressure with fixed separation lines, while this body’s drag is wrong by a factor of four.
A bug on the way. The first model rounded only the nose’s top and bottom edges, not its sides. Air separating off those sharp corners gave OpenFOAM a Cd stuck near 0.44 on any mesh (0.474, 0.445, about 0.44 on 219k, 753k and 4.3M cells) and 0.51 to 0.53 at 35°. All Ahmed numbers before this correction are void, including those in aerodynamics.md §10.
6.1 Where the tunnel goes wrong: surface pressure¶
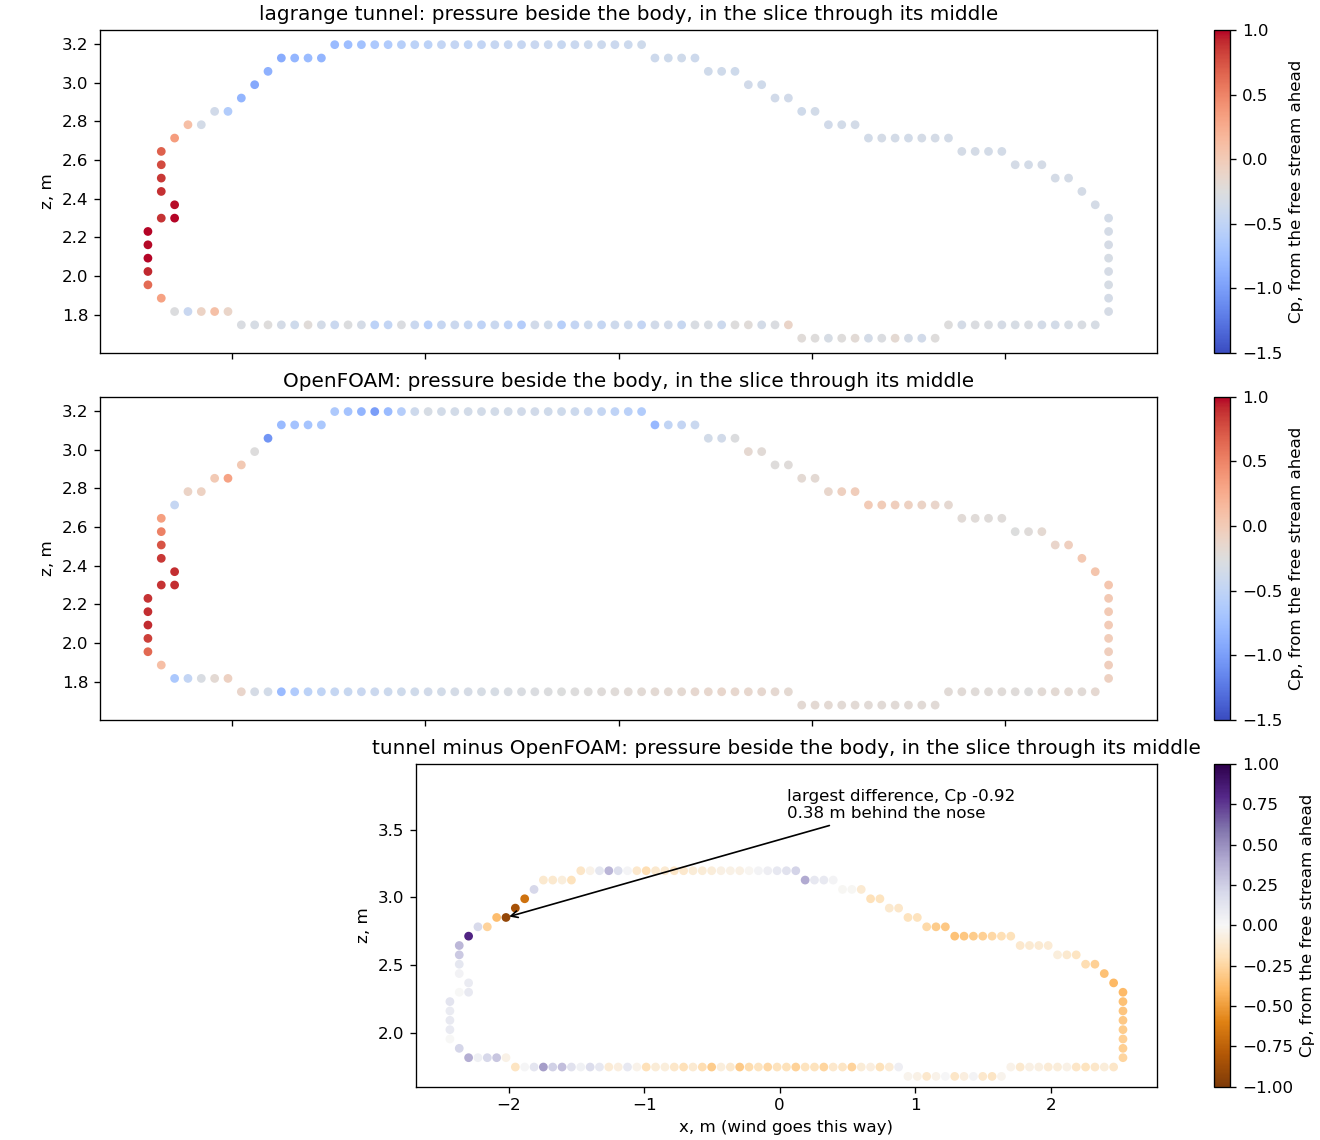
lagrange_foam_compare CASE TUNNEL_DIR OUT.png --speed U reads \(C_p\) beside the body from both tools, in
the slice through its middle, each from its own free stream ahead of the body, and marks where they differ
most. Ahmed body at 25°, tunnel on 8M cells, OpenFOAM on 750k:
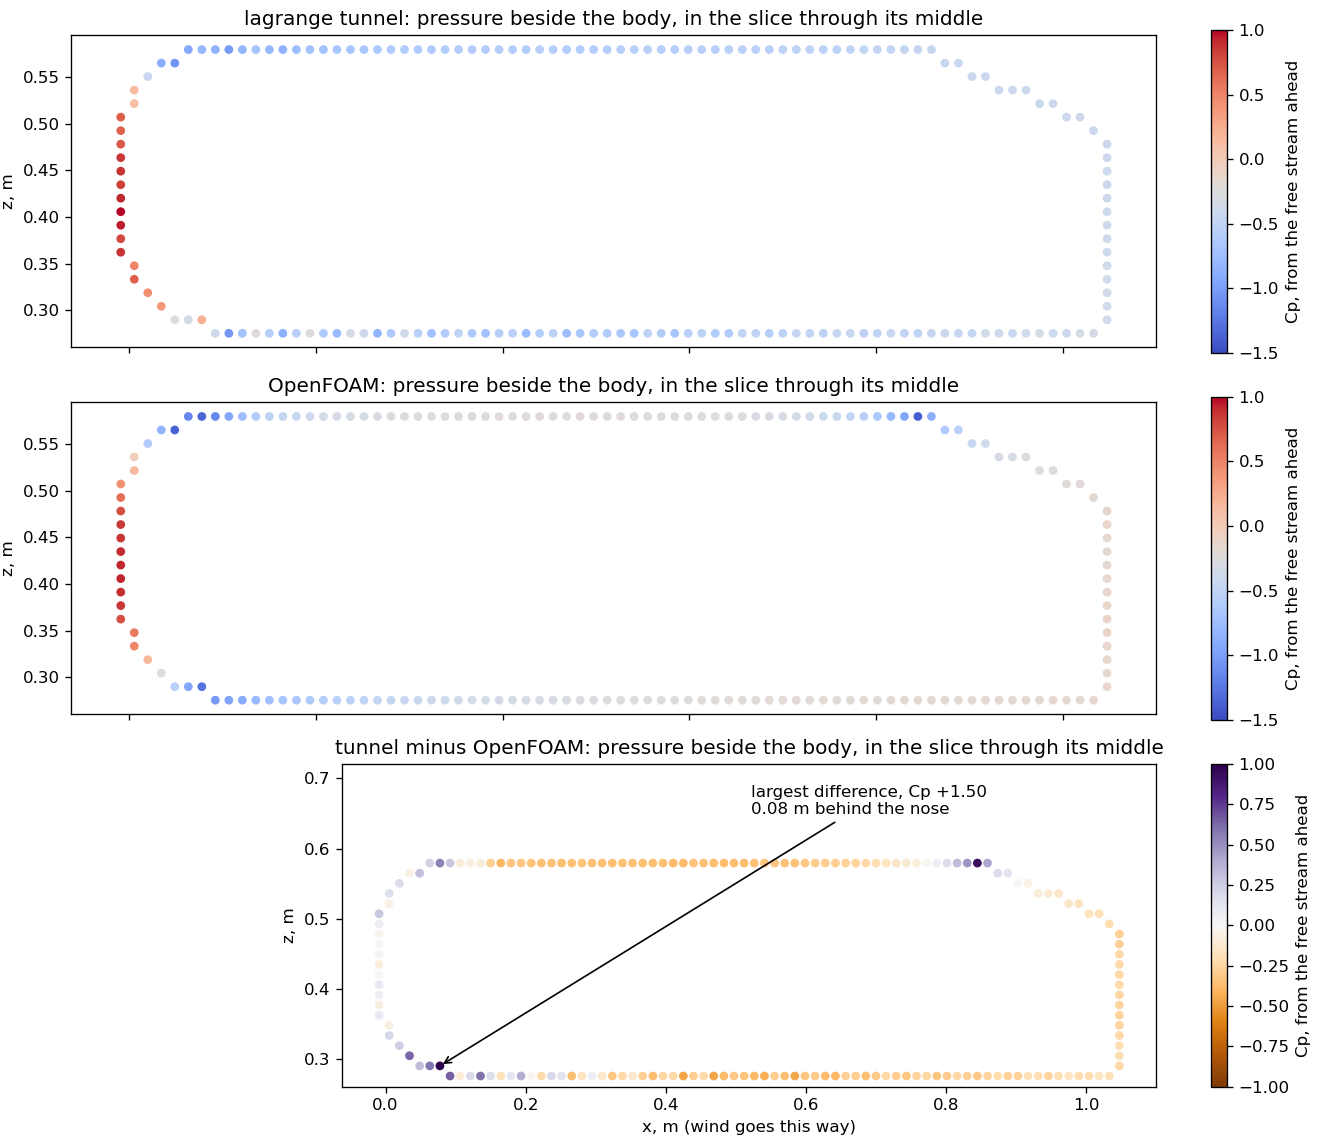
Where |
Tunnel |
OpenFOAM |
|---|---|---|
Front face, mean |
0.42 |
0.31 |
Top and bottom faces, by eye from the figure |
about −0.5 |
about −0.1 |
Base, mean |
−0.38 |
−0.14 |
Front minus base |
0.80 |
0.45 |
Largest difference |
Bottom nose shoulder, 0.08 m behind the nose, \(C_p\) +1.50 |
flowchart LR
    A[Nose front: both agree] --> B[Nose shoulder: OpenFOAM has a strong suction peak, the tunnel does not]
    B --> C[Long faces: the tunnel stays low, as if the air stayed detached]
    C --> D[Base: stronger suction in the tunnel]
    D --> E[More drag]
So the leading explanation is air leaving the staircase surface at the nose shoulder and not coming back, which the speed frames also show as a thick layer along the body. This is one slice, and front minus base at 0.80 does not by itself make a Cd of 1.26; the sides and friction are not in it. It is a lead, not yet proof, and it says nothing yet about whether the stripes contribute.
6.2 A real car: the Lexus RX 450h¶
The body mesh is Autoware’s lexus.dae (fetch_assets lexus_rx450h), baked into 38 convex parts with
lagrange bake --threshold 0.04, since the sample’s own collision shape is one box. Wind 30 m/s, one run
each. Published Cd: 0.33 for the RX (Lexus UK specification), 0.34 for the AL20 450h AWD (Ultimate Specs).
Tool |
Cells |
Frontal area |
Road gap |
Cd |
Cl |
Wall time |
|---|---|---|---|---|---|---|
OpenFOAM |
966,776 |
2.66 m² |
20 mm |
0.241 ± 0.002 |
0.231 ± 0.016 |
21 min |
Tunnel |
8M |
2.73 m² |
137 mm |
0.942 ± 0.008 |
0.463 |
10 min |
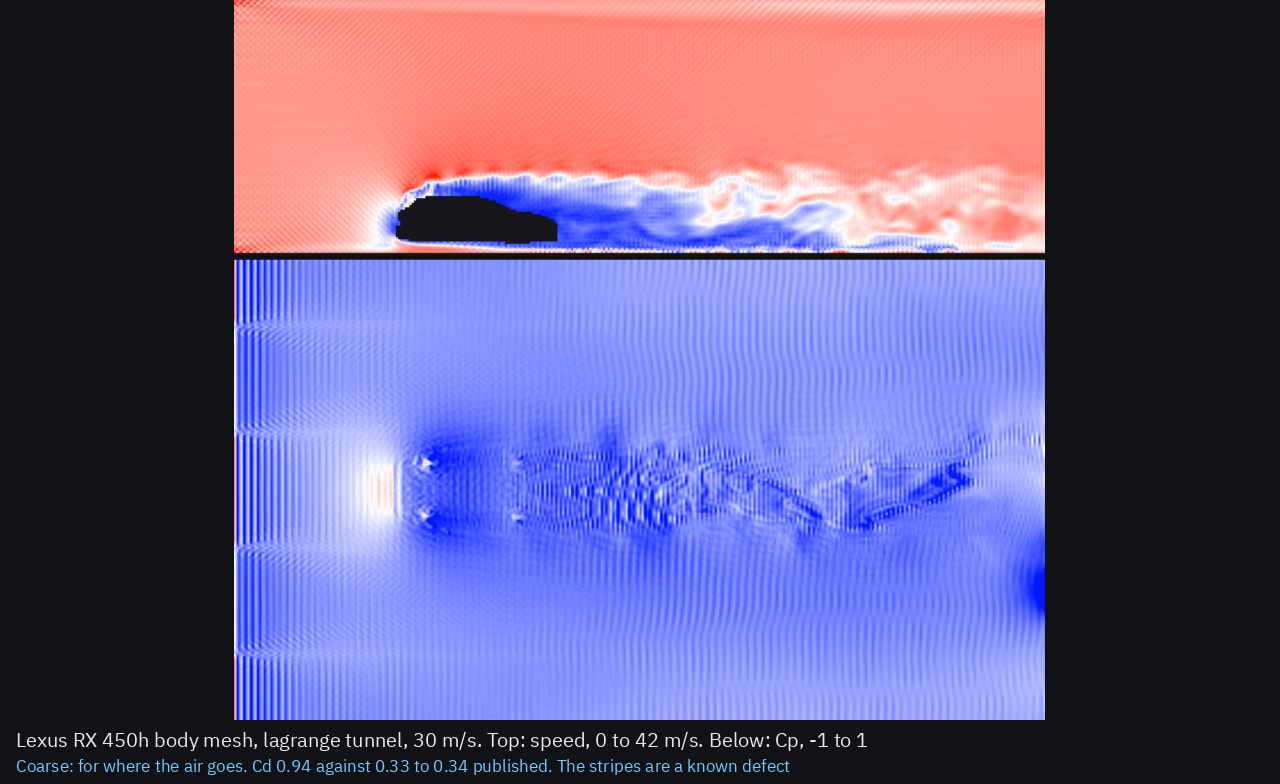
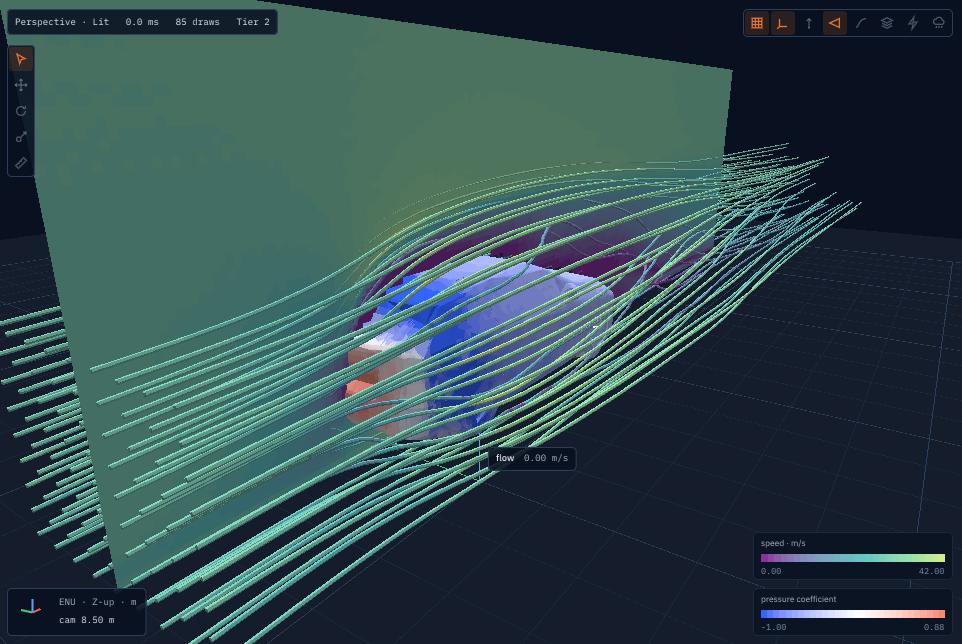
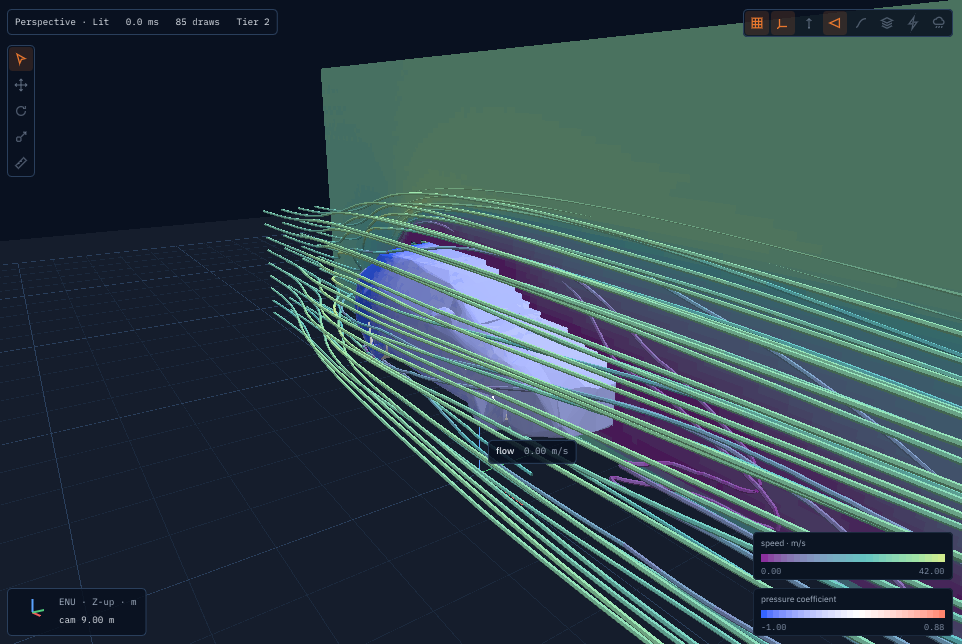
Video: wind_tunnel_lexus.mp4.
OpenFOAM’s pressure on the car, from pressure.png:
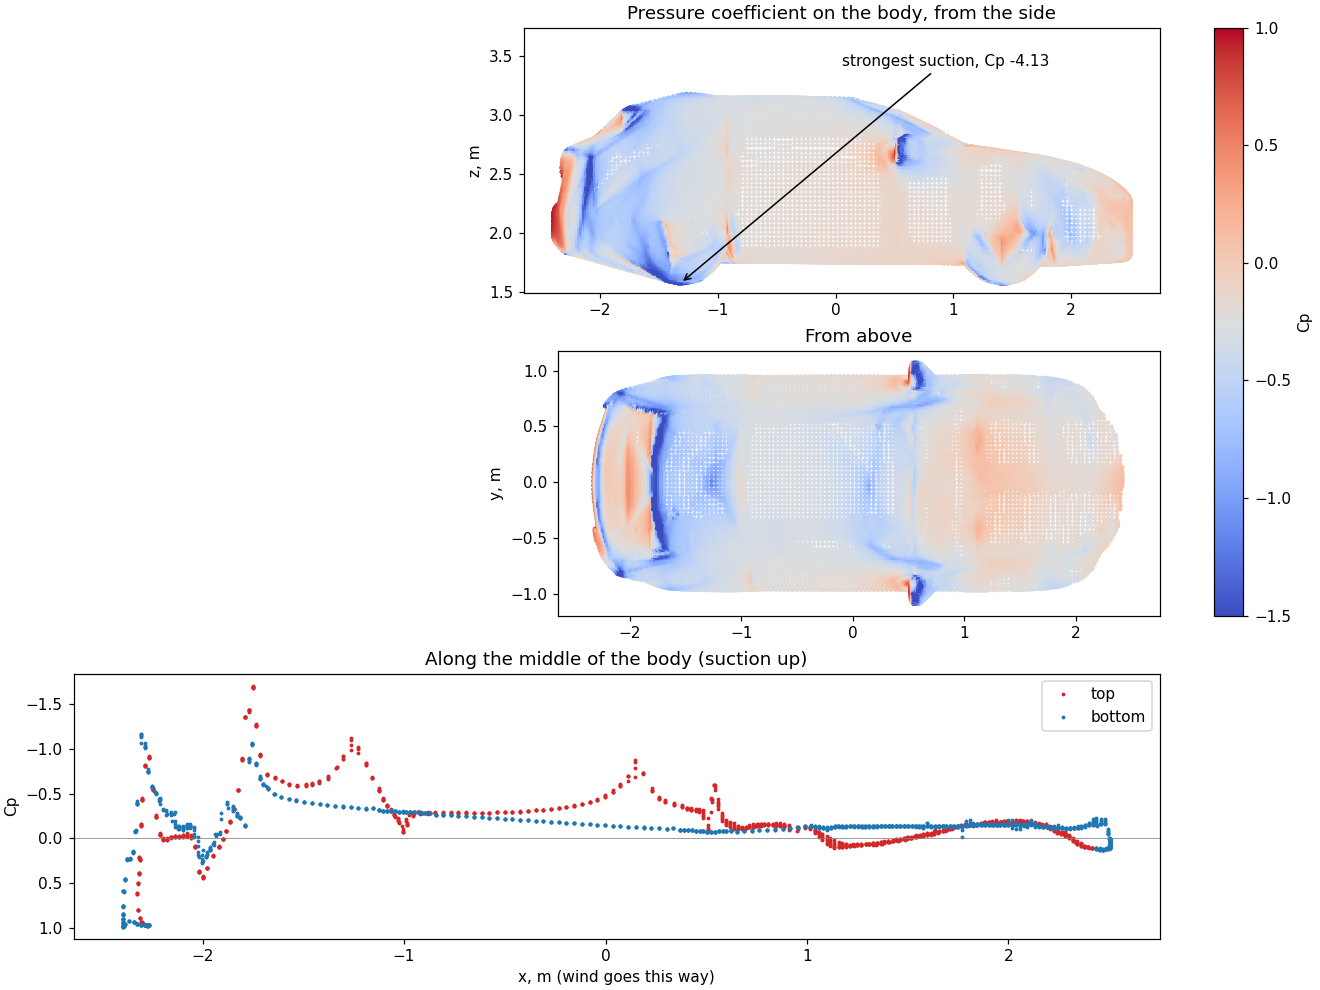
The front bumper and grille stand at stagnation (\(C_p\) near 1), the hood’s leading edge, the A-pillars and the mirrors show suction, and the tailgate sits near 0. The strongest suction marked, \(C_p\) −4.1, is under a front wheel where the 20 mm gap to the road chokes the air, likely an effect of that gap rather than of the car.
How to read these:
OpenFOAM reads about 28 % below the published car. The model has a smoothed underside, wheels that do not turn, no air through the engine bay, and convex parts that may fill gaps. Which of these accounts for how much has not been measured, and one mesh level says nothing about mesh independence.
checkMeshalso reported one failed check, a single face of high skewness (4.3), which may affect the result.The tunnel reads nearly three times too high, and the same pattern as the Ahmed body appears: lower pressure along the hood and windscreen edge, largest difference \(C_p\) −0.92 about 0.38 m behind the nose, and base −0.32 against −0.01.
The gaps differ. The tunnel’s minimum of two cells widened its gap from the 20 mm asked to 137 mm, so the two runs are not the same geometry under the car.
These are colour and streamline pictures of the convex parts, not the car’s textured look. The small “flow 0.00 m/s” chip in the viewer is a selected prim’s label, not the wind.
7. What was tried on the tunnel and not adopted¶
Each was run by hand and left out because it moved references away from their measurements:
Change |
Result |
Why not |
|---|---|---|
Regularized collision (Latt & Chopard 2006) |
Cube 1.44, plate 0.85 |
Worse, and a test fails |
Sponge at both ends |
Checkerboard 44.8 to 24.0, cube 1.28 |
The cube moves away from 1.05 |
Sponge plus viscosity floor 0.005 |
Checkerboard 6.7, cube 1.69 |
Further still |
Log-law moving wall |
Plate friction 0.013, cube 0.69, Ahmed Cd −8.25 |
Pushes air on staircases |
Velocity inlet and pressure outlet, plain equilibrium |
Cube −1.46, GPU and CPU disagree |
Unstable or worse |
Pressure outlet with Guo’s extrapolation only |
Cube −6.20 |
Worse |
Guo’s extrapolation at both ends |
Cube 0.88, plate 0.87 |
Worse, and the plate’s test fails |
Two more were tried on the CPU after section 6.1 pointed at the nose shoulder. Ahmed body at 25°, 1M cells:
Change |
Road gap |
Cd |
Cl |
Cube |
Plate |
|---|---|---|---|---|---|
Neither |
2 cells |
1.19 |
0.79 |
1.03 |
0.97 |
Density correction |
2 cells |
1.19 |
0.80 |
1.02 |
0.96 |
Curved walls |
2 cells |
0.69 |
3.25 |
1.30 |
0.97 |
Curved walls and density correction |
2 cells |
0.74 |
3.30 |
1.28 |
0.96 |
Density correction |
200 mm |
1.17 |
0.13 |
||
Curved walls and density correction |
200 mm |
1.06 |
0.17 |
Curved walls (interpolated bounce-back, Bouzidi, Firdaouss & Lallemand 2001) place the wall on the true surface along each link, for a surface a fraction \(q\) along the link:
The 0.69 looked like the breakthrough and is not one: it comes with lift 3.3 against OpenFOAM’s 0.29 and high pressure under the body, and with room under the body the gain shrinks to 9 % (1.17 to 1.06). They also take the cube from 1.03 to 1.28, past its lift test. Not adopted. So a smoother wall alone does not explain the excess; section 6.1’s shoulder remains where the tools differ, not yet why. The run with no road did not finish in the time given.
Density correction subtracts the mean drift from all fluid cells every step, \(f_i\leftarrow f_i-w_i(\bar\rho-1)\). It removes the free stream’s negative \(C_p\) offset and leaves cube, plate and drag about where they were, so the offset was not driving the drag. The stripes remain. It is CPU only so far, and the GPU would need its own version, so it is not adopted yet either.
Cube and plate figures are at their test grids. Their measured values are 1.05 and 1.17; without these changes they read 1.03 and 0.97.
Wall functions (2026-11-03)¶
The friction defect below points at the boundary layer: next to a wall the Smagorinsky viscosity is
about \(C_s^2\Delta U\), so each wall cell behaves like laminar flow at a cell Reynolds number near
\(1/C_s^2\approx35\) whatever the true Reynolds number. A wall function should give the wall the log
law’s stress \(\rho u_\tau^2\) instead, with \(u_\tau\) from Spalding’s law of the wall (J. Appl. Mech.
28, 1961) at a cell further out. Four forms were built on the CPU and measured on a 1 m plate along a
20 m/s wind at 1 cm cells (DISABLED_AFlatPlatesFrictionAgainstTheTurbulentLaw, the law 0.0042) and
on a bluff plate facing the wind (measured Cd 1.17, 0.97 without any of them):
Form |
Plate friction Cf |
Bluff plate Cd |
Why it fails |
|---|---|---|---|
None |
0.0130 |
0.97 |
3.1 times the law |
Hand back what bounce-back takes beyond the law, as a force along the wall |
runs away, Cf −0.063 |
the momentum handed back is bounced again next step |
|
Rebuild the wall cell at the law’s velocity with the law’s stress (after Malaspinas and Sagaut, Journal of Computational Physics 275, 2014) |
0.0046 |
−2.86 |
friction right, but pressure on the plate inverts (front \(C_p\) −2.0): the rebuild discards what bounce-back needs at stagnation; easing it in per step did not cure it |
Partial slip, bounce-back mixed with mirroring (Succi, PRL 89, 2002), the share set by the law |
0.33 |
0.27 |
the wall cell runs faster than the free stream: near free slip at τ ≈ 0.5 is unstable in BGK |
The wall cell’s viscosity set so that bounce-back’s friction is the law’s, the next three cells given the log layer’s \(\kappa y u_\tau\) |
0.015–0.027 |
1.10–1.21 |
below τ ≈ 0.501 the wall cells over-relax (ω ≈ 2) and bounce-back’s momentum is then oscillation, not stress |
None was kept. What would likely work is a wall cell whose collision stays stable as τ → ½ (two relaxation times with the wall placed exactly, or a regularized collision only there) under the log-layer viscosity, then the Ahmed body again; that is a research step, not a fix.
8. Known defects¶
Stripes and offset. The pressure panel shows stripes two cells wide starting at the inlet, and the free stream reads a negative \(C_p\) where it should be about 0. The offset is mean density drifting (section 7 removes it on the CPU). The stripes’ source is still open, as is their link to the checkerboard in speed and spin.
Wall friction too high. A plate along the wind reads 0.037 at 1M cells and 0.014 at 4M, against about 0.0037 for a turbulent flat plate. Those figures included the plate’s blunt ends: measured alone (2026-11-03, a 1 m plate at 1 cm cells, Re 1.3·10⁶), friction is Cf 0.0130 against the turbulent law’s 0.0042, 3.1 times, and the one-cell ends add another 0.010. Section 7 lists the wall functions tried against it.
Lift is not settled in either tool.
9. Next¶
Decide what the tunnel is for. Three changes meant to bring its drag down did not (sections 6 and 7). The owner’s call: keep it for seeing the flow and use
lagrange foamfor numbers, or go on to a wall treatment using these true wall distances, whose outcome is uncertain.Finish the reference. A finer OpenFOAM mesh at 25°, and the 35° reference checked at its source.
Local refinement, below, only if step 1 leaves resolution as the limit.
Local refinement for the tunnel¶
Finer cells only where the air needs them, by blocks at a 2:1 ratio. Keeping \(\nu\) continuous across levels fixes the relaxation time, and the equilibrium part of a population carries over unchanged while the off-equilibrium part scales with the velocity gradient (Dupuis & Chopard 2003; Rohde et al. 2006):
TODO(verify): \(\alpha\) and exactly when in the step it is applied against Dupuis & Chopard, Phys. Rev.
E 67, 066707; secondary sources disagree on the timing.
flowchart LR
    C[Coarse block: 1 step] --> I[Interface: rescale, interpolate]
    I --> F[Fine block: 2 steps]
    F --> A[Interface: average back]
    A --> C
Done means, in this order: a uniform flow stays uniform across an interface; the shear wave keeps its decay rate; cube and plate stay within their tests on fewer cells than today; then the Ahmed body, with OpenFOAM as the reference on the same shape. Interfaces are known to radiate spurious noise (arXiv 2004.11863), so section 8’s stripes should be understood first. A finite-volume solver of our own would need an RFC, since invariant 12 prefers integrating engines.
10. Sources¶
OpenFOAM: openfoam.com, v2606 documentation, licence
Ahmed body: ERCOFTAC AC1-05, SimScale validation, arXiv 2001.11074
Refinement: arXiv 1608.06915, arXiv 2004.11863
Textbook and papers cited from memory of their standard forms, not re-read here: Krüger et al. 2017, Hou et al. 1996, Ladd 1994, Menter 1994, Jasak 1996.
TODO(verify)the SST and SIMPLE forms against them.